Meet the toolkit
Lecture 2
R and RStudio
![]()
- R is an open-source statistical programming language
- R is also an environment for statistical computing and graphics
- It’s easily extensible with packages
![]()
- RStudio is a convenient interface for R called an IDE (integrated development environment), e.g. “I write R code in the RStudio IDE”
- RStudio is not a requirement for programming with R, but it’s very commonly used by R programmers and data scientists
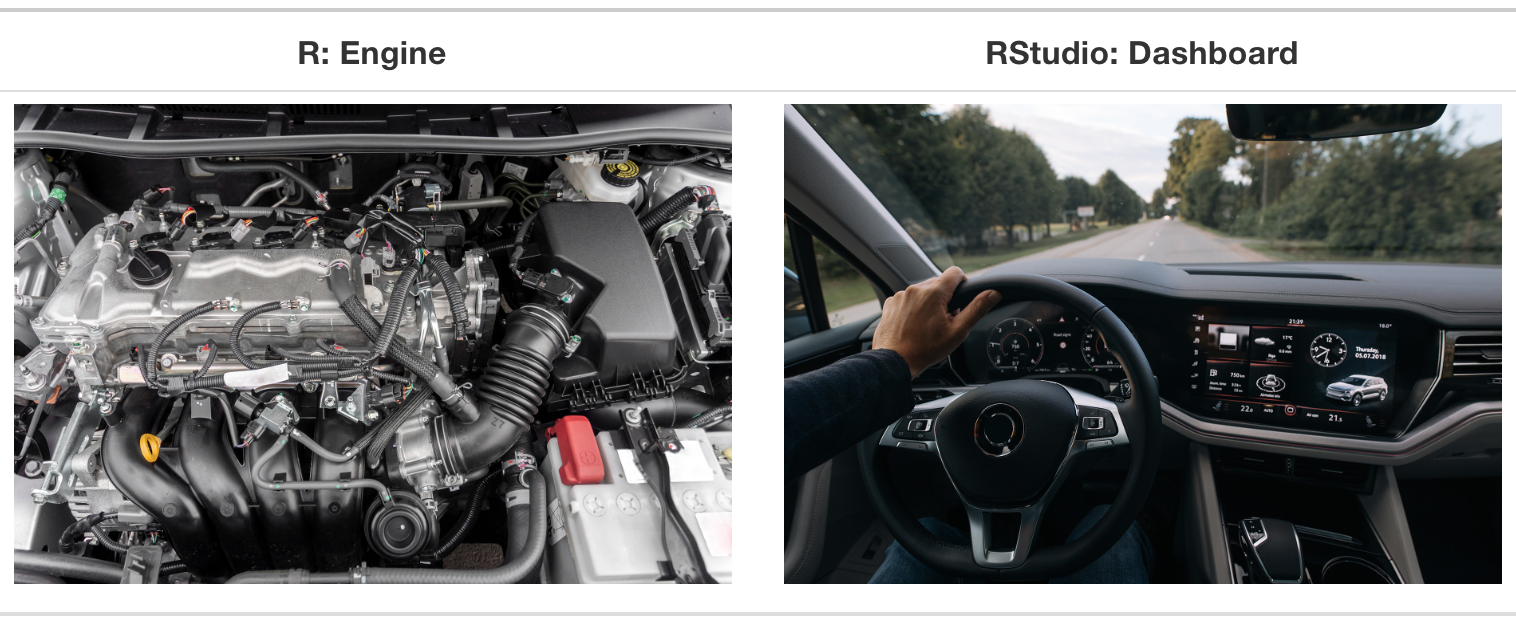
R vs. RStudio
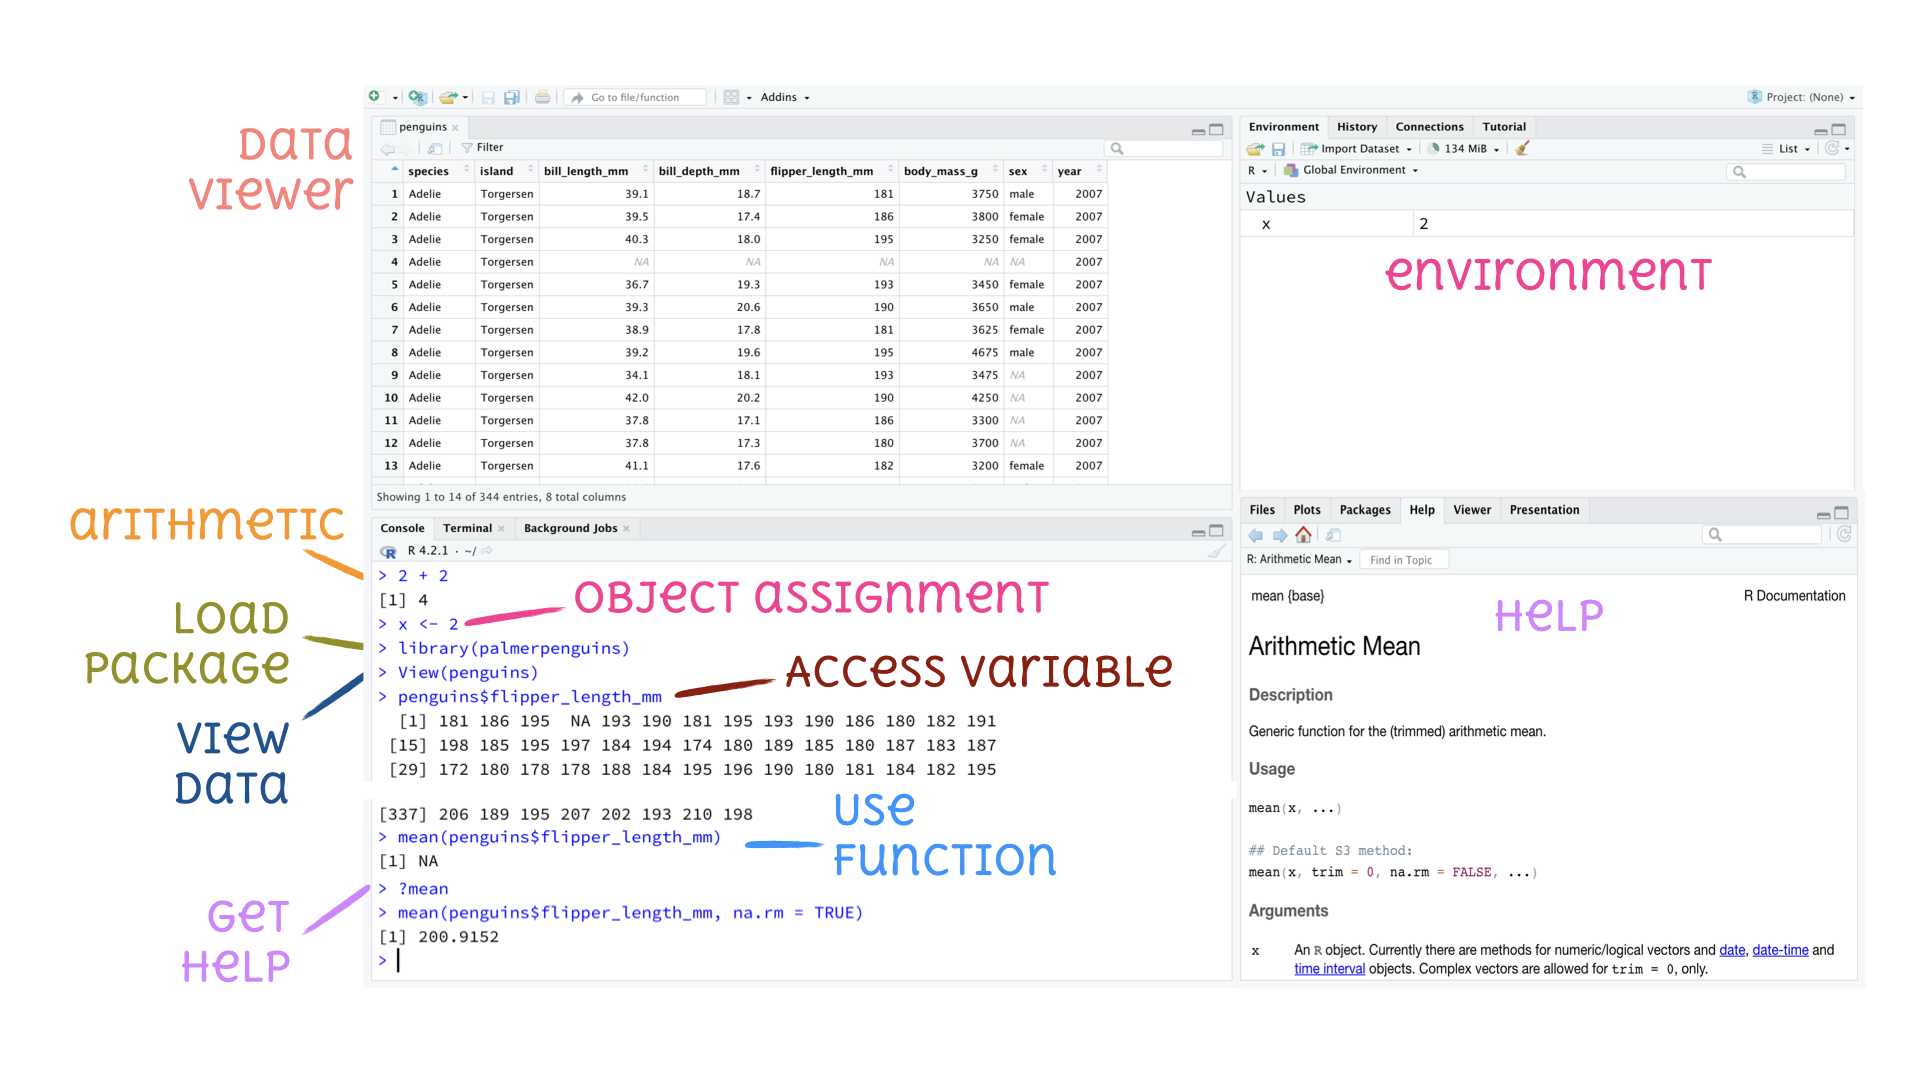
Tour: R and RStudio
tidyverse
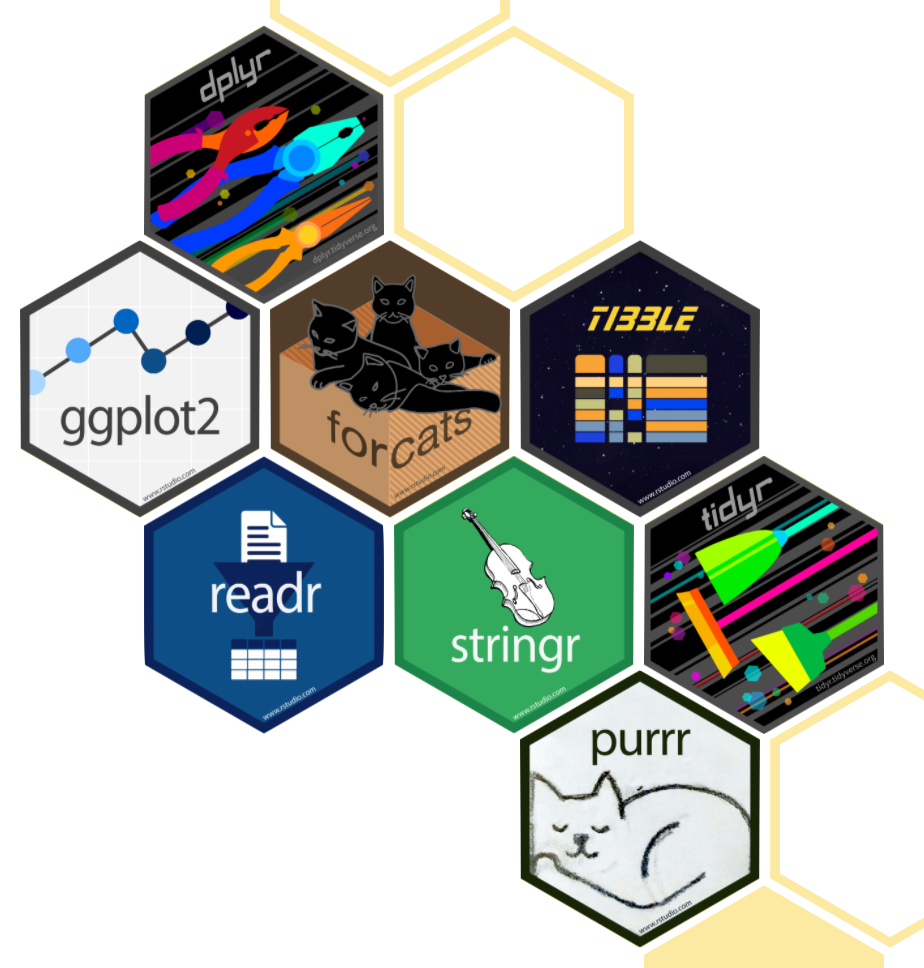
- The tidyverse is an opinionated collection of R packages designed for data science
- All packages share an underlying philosophy and a common grammar
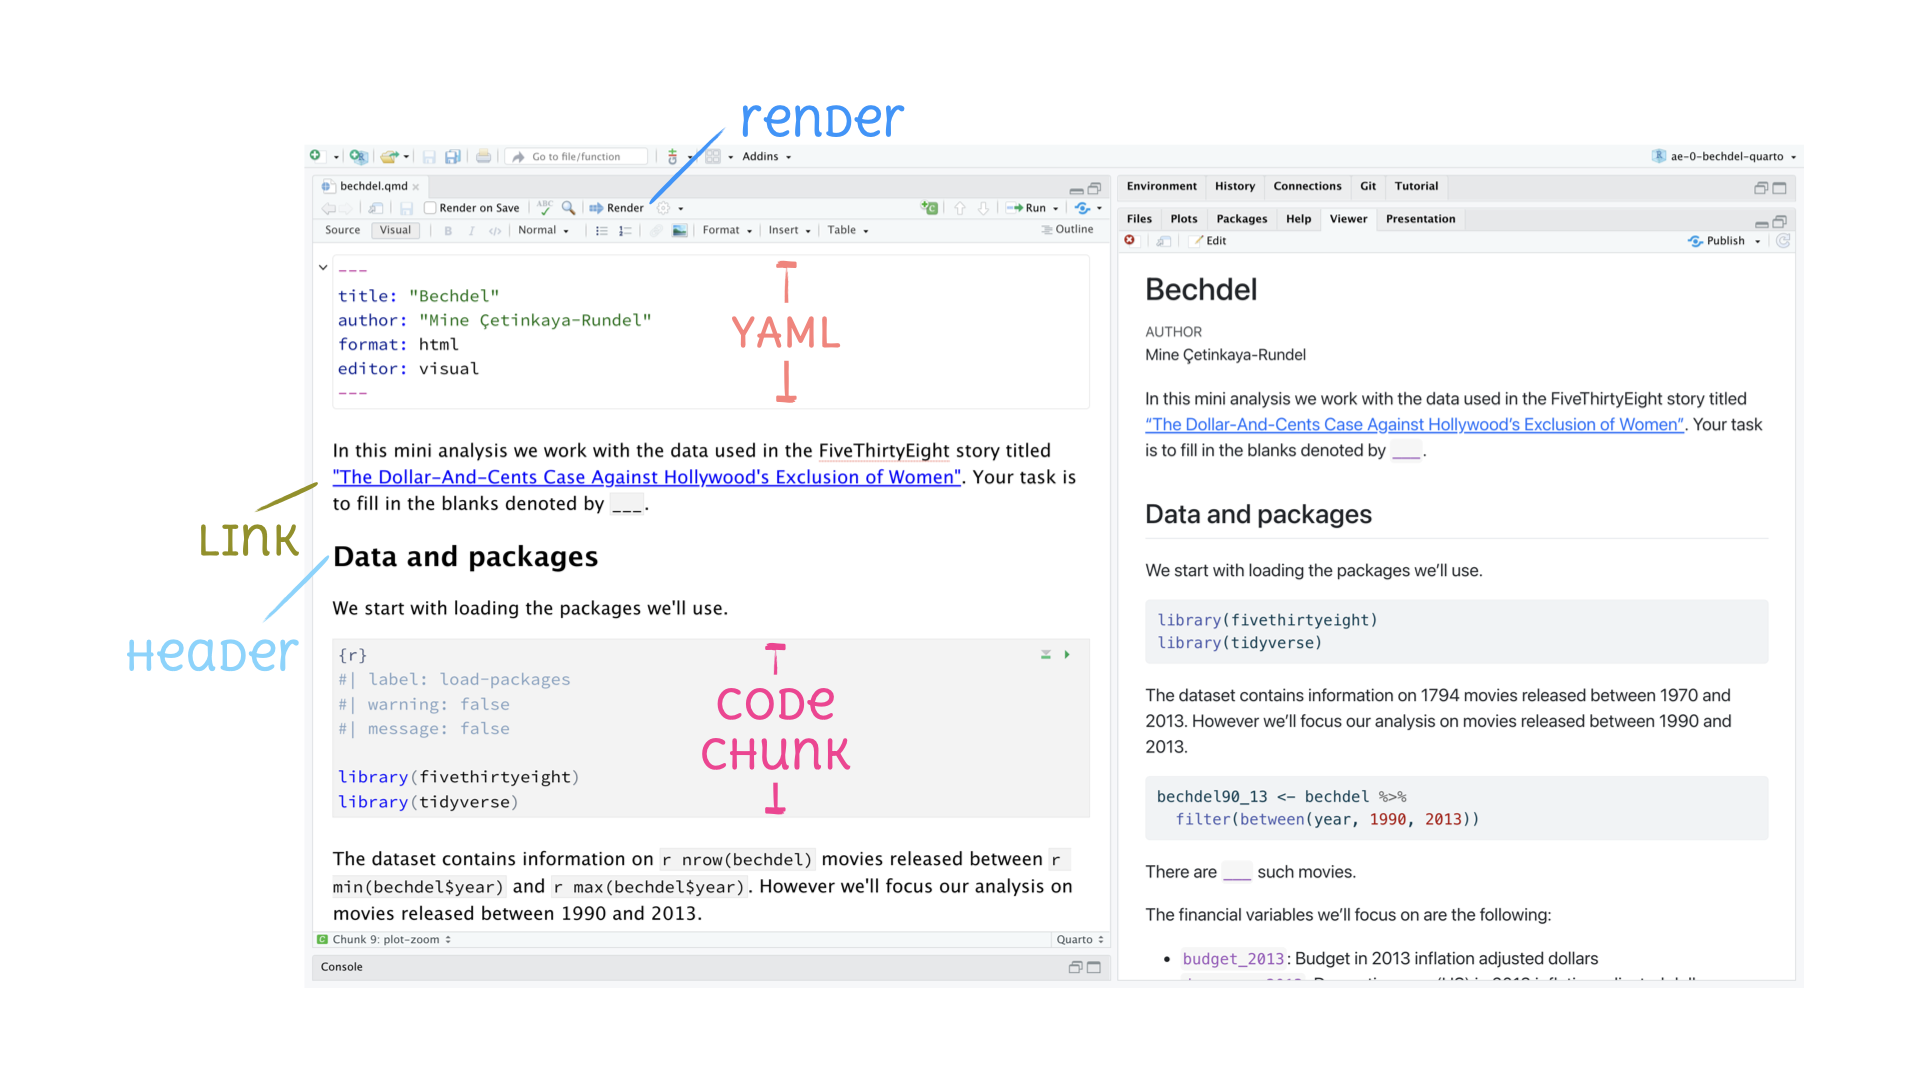
Tour: Quarto
Next time
We’ll continue out “Meet the toolkit” journey, focusing on version control tools, Git and GitHub, the last piece of the puzzle
We’ll then move on to the nuts and bolts of data visualization in R with ggplot2
![]()