Visualizing various types of data

Lecture 4

Dr. Mine Çetinkaya-Rundel

Duke University
STA 113 - Fall 2023

Warm up

Reflection

What is one thing you learned from your reading or videos that was “new” to you? And what is one question you have from the reading, videos, or material we’ve covered so far, including the previous application exercise?

Announcements

  • HW 1 due next Tuesday at 1 pm
  • Office hours – move to in person?

Types of data

Identifying variable types

Identify the type of each of the following variables.

  • Favorite food
  • Number of classes you’re taking this semester
  • Zip code
  • Full name
  • Age

The way data is displayed matters

What do these three plots show?

Three representations of the same data: Bar plot of means, box plots, histograms.

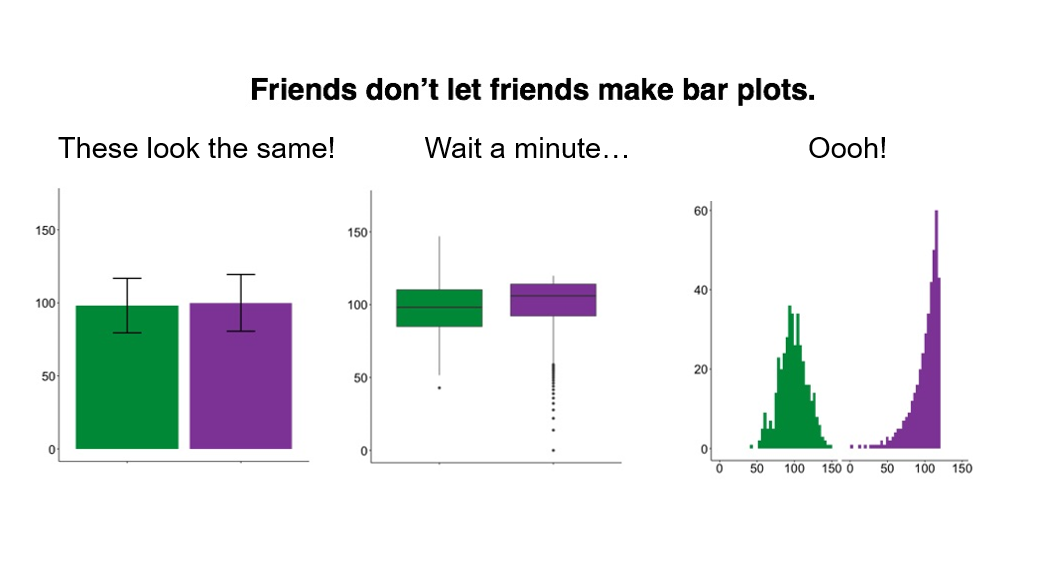
Source: #barbarplots

Application exercise

ae-04

  • Go to the course GitHub org and find your ae-04-sat (repo name will be suffixed with your GitHub name).
  • Clone the repo in Posit Cloud, open the Quarto document in the repo, set up a new PAT, and follow along and complete the exercises.
  • Render, commit, and push your edits as you work through it

Recap of AE

  • Pick geoms based on data types.
  • Set appropriate binwidths for histograms.
  • Turn off legends when they provide redundant information with show.legend = FALSE.
  • Create plots with multiple geoms, and pay attention to order.