Visualizing and modeling relationships I
Lecture 10
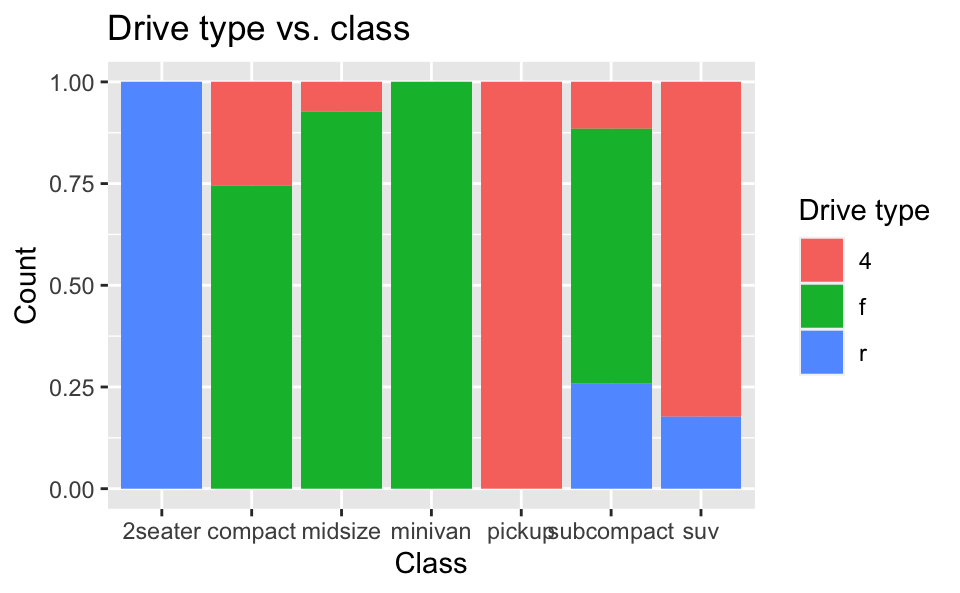
Two categorical variables
What type of plot would you use to visualize the relationship between two categorical variables?
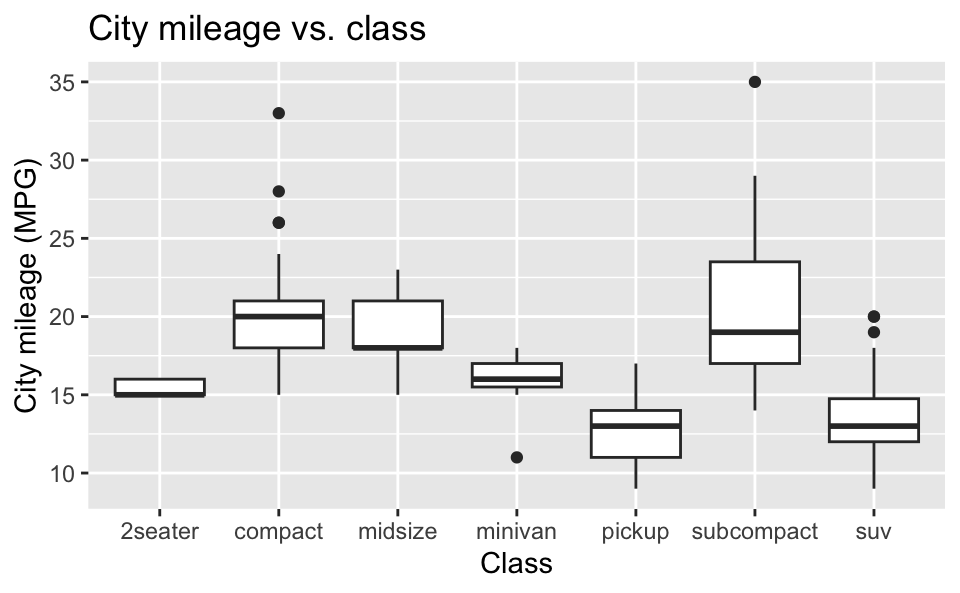
One categorical, one numerical variable
What type of plot would you use to visualize the relationship between one numerical and one categorical variables?
Two numerical variables
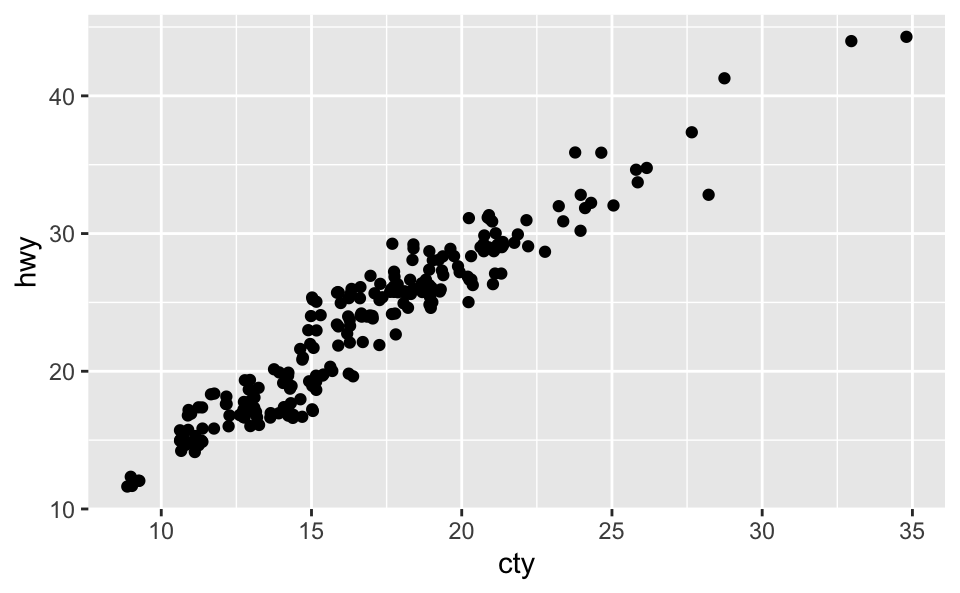
What type of plot would you use to visualize the relationship between two numerical variables?
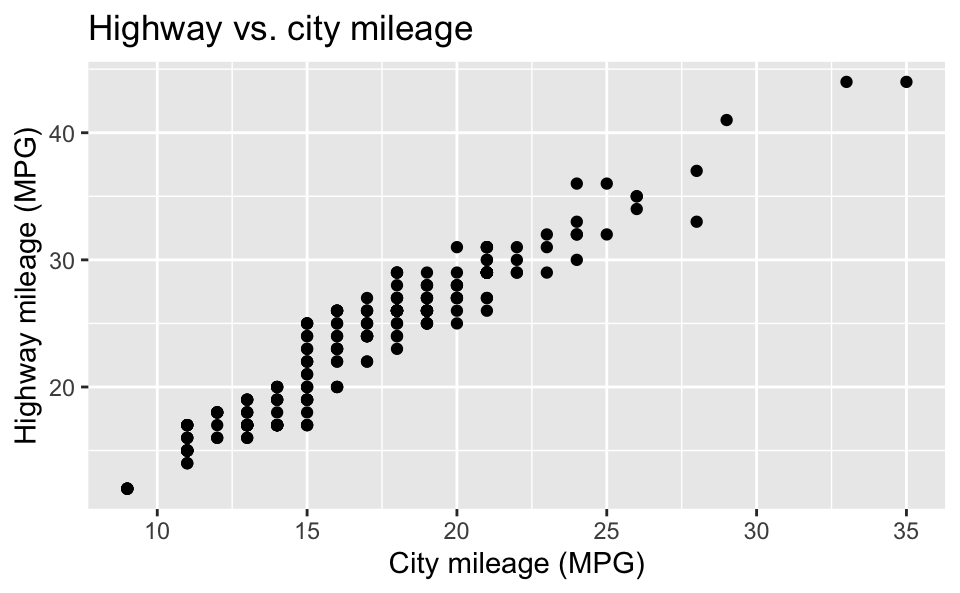
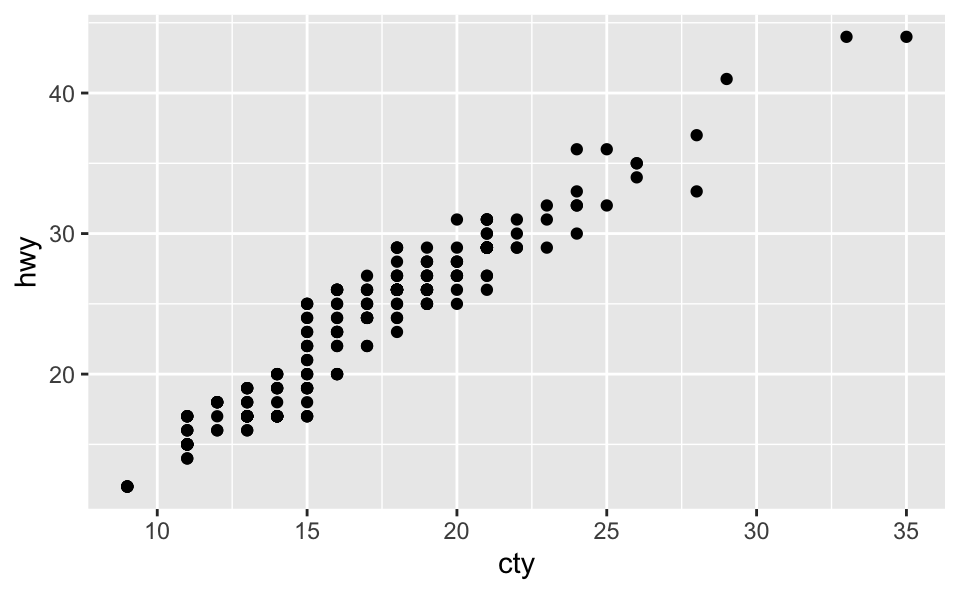
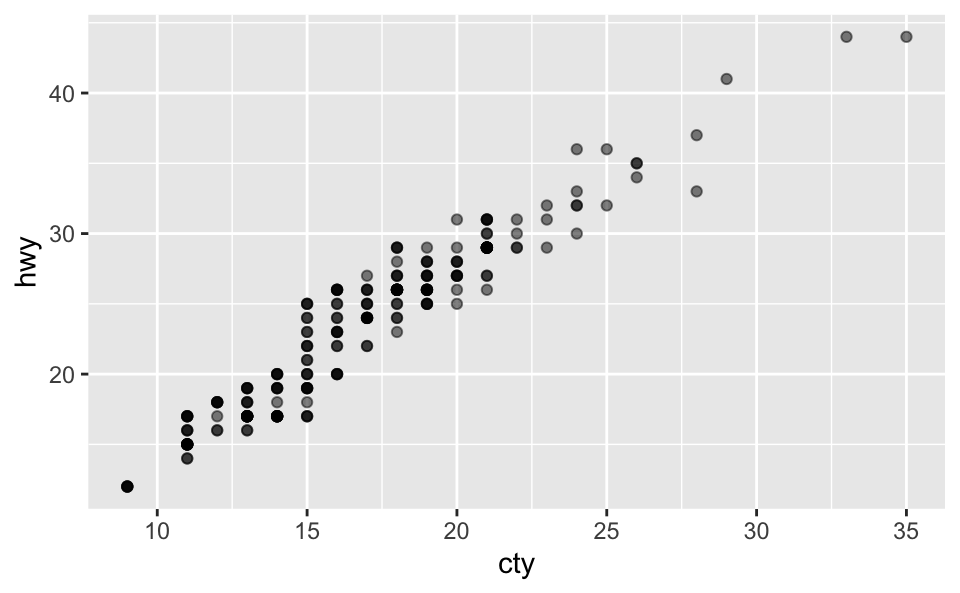
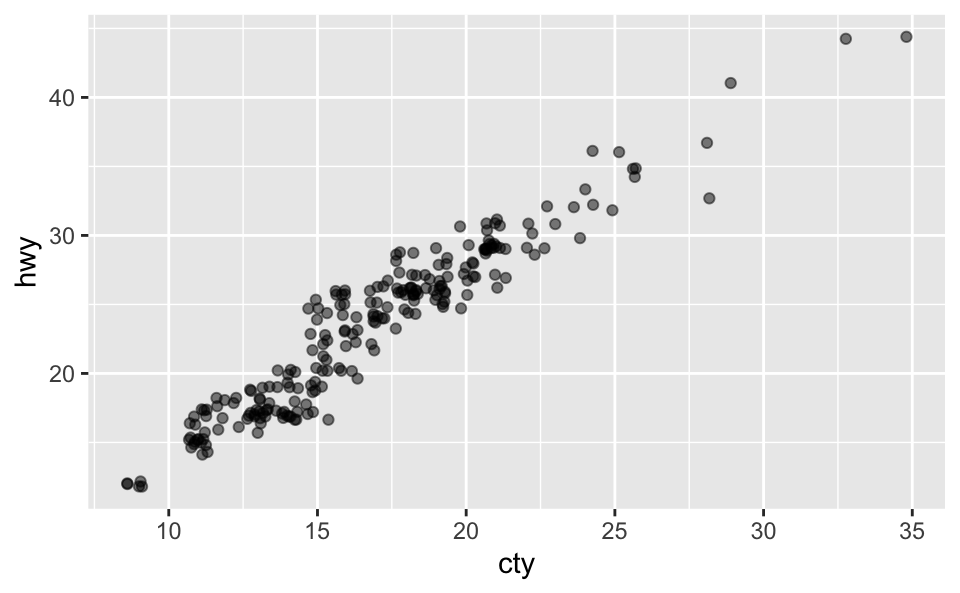
Let’s look a little closer
Roughly how many points are there in the plot? How many points are there supposed to be? If there is a discrepancy, what explains it?
Adjust alpha
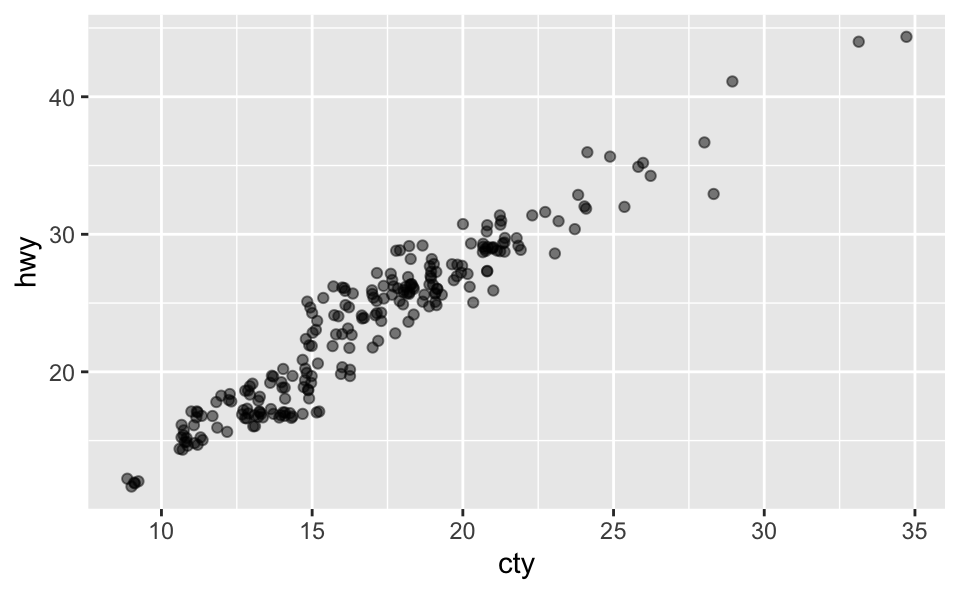
Jitter
Adjust alpha + jitter
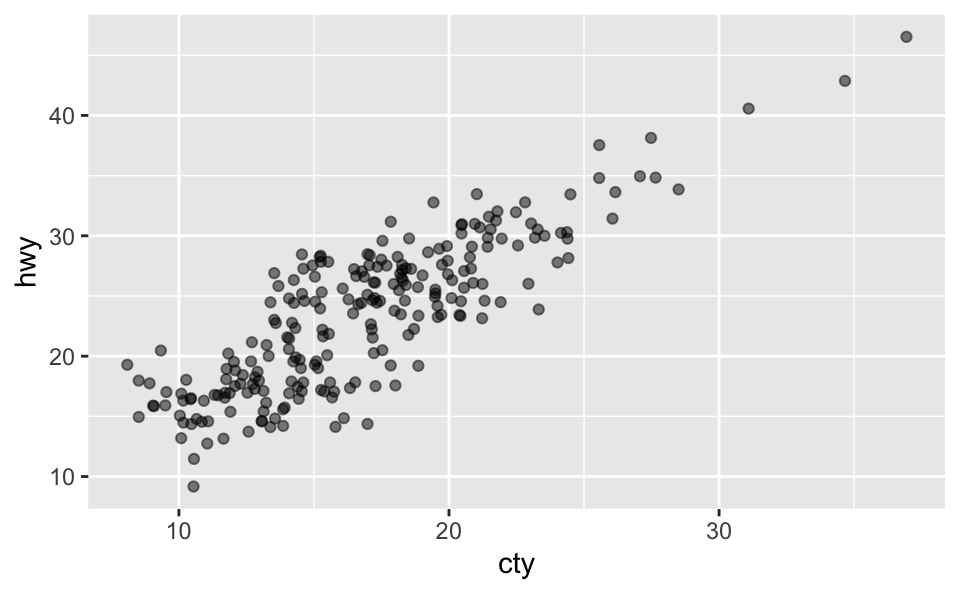
Add more jitter
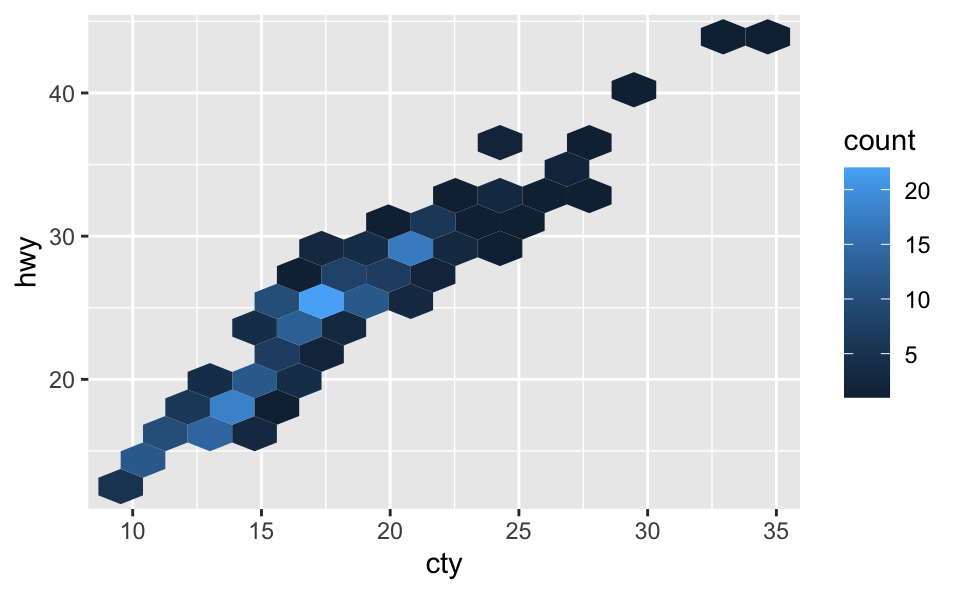
Bin the data
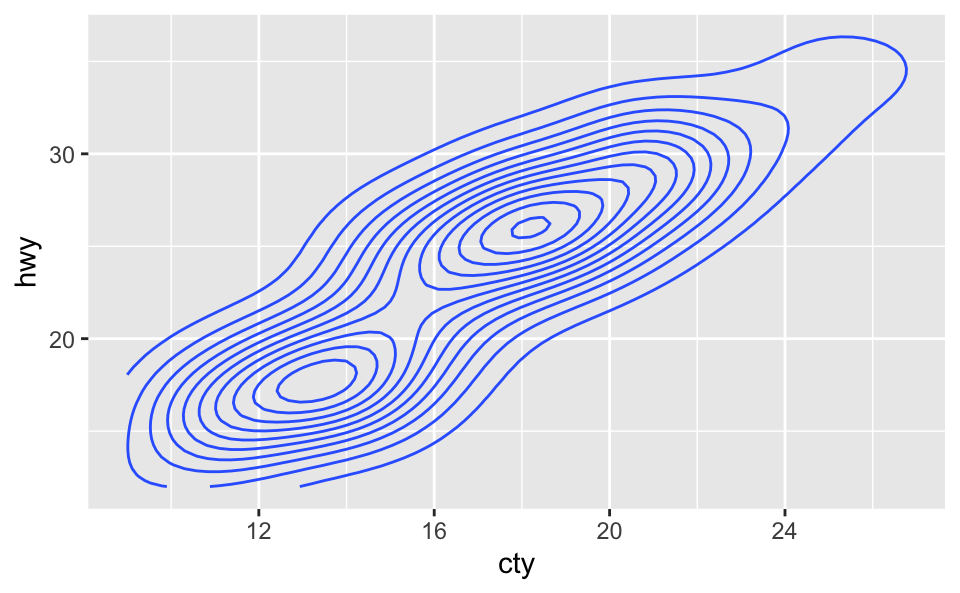
Contour 2D density
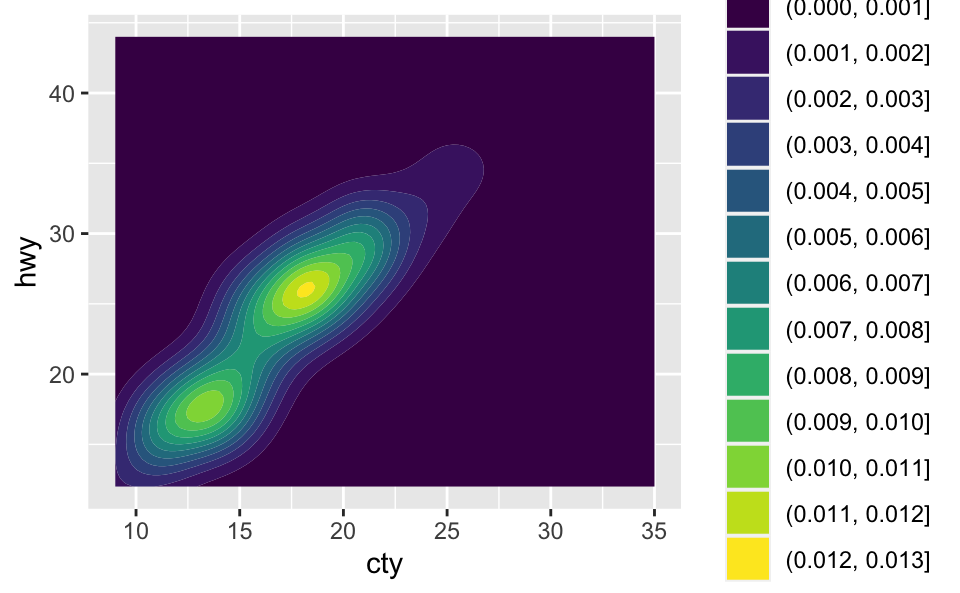
Filled contour 2D density
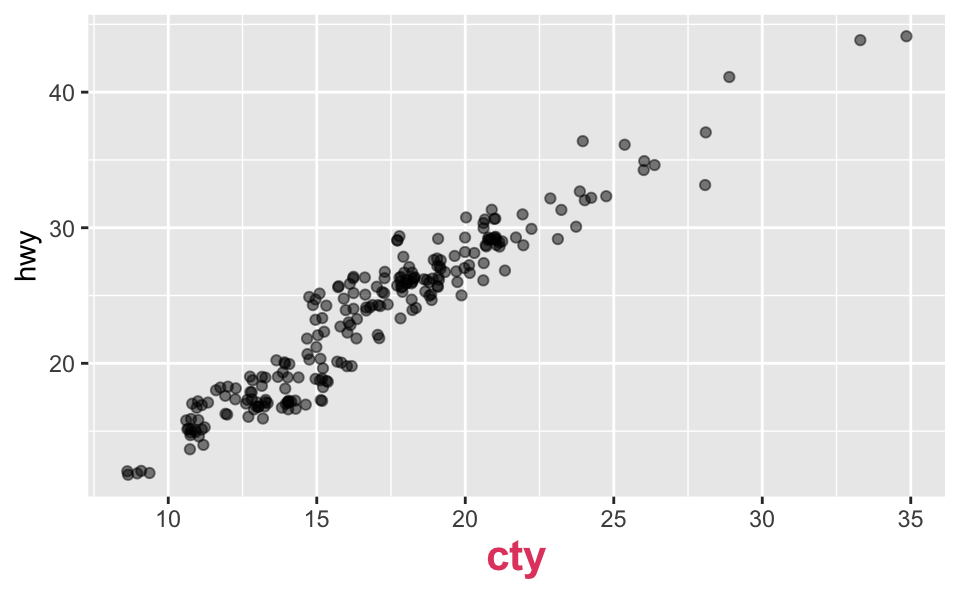
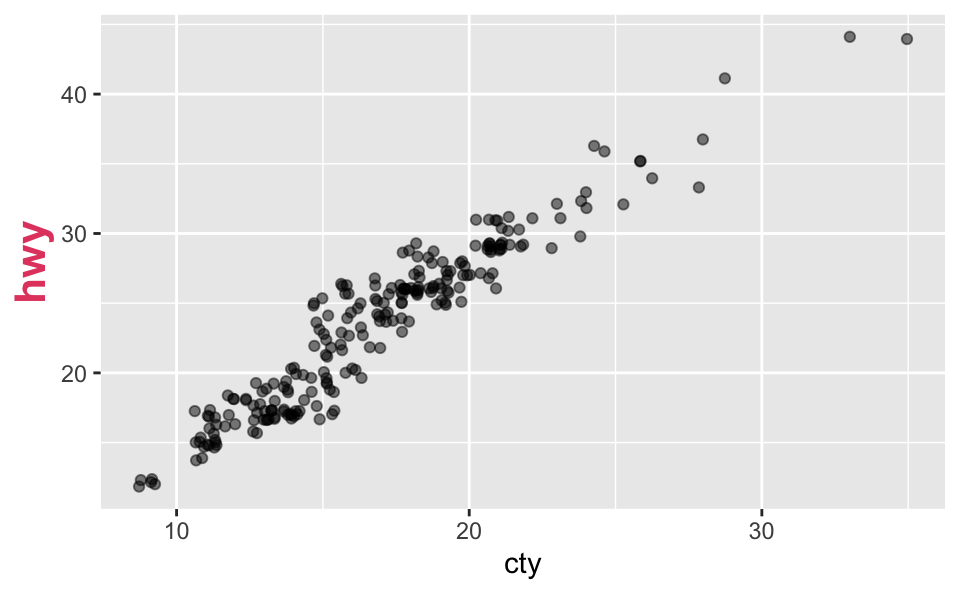
Modelling cars
- What is the relationship between cars’ city and highway mileage?
- What is your best guess for a car’s highway MPG that gets 20 MPG in the city?
Predictor (explanatory variable)
| cty | hwy |
|---|---|
| 18 | 29 |
| 21 | 29 |
| 20 | 31 |
| 21 | 30 |
| 16 | 26 |
| 18 | 26 |
| ... | ... |
Outcome (response variable)
| cty | hwy |
|---|---|
| 18 | 29 |
| 21 | 29 |
| 20 | 31 |
| 21 | 30 |
| 16 | 26 |
| 18 | 26 |
| ... | ... |
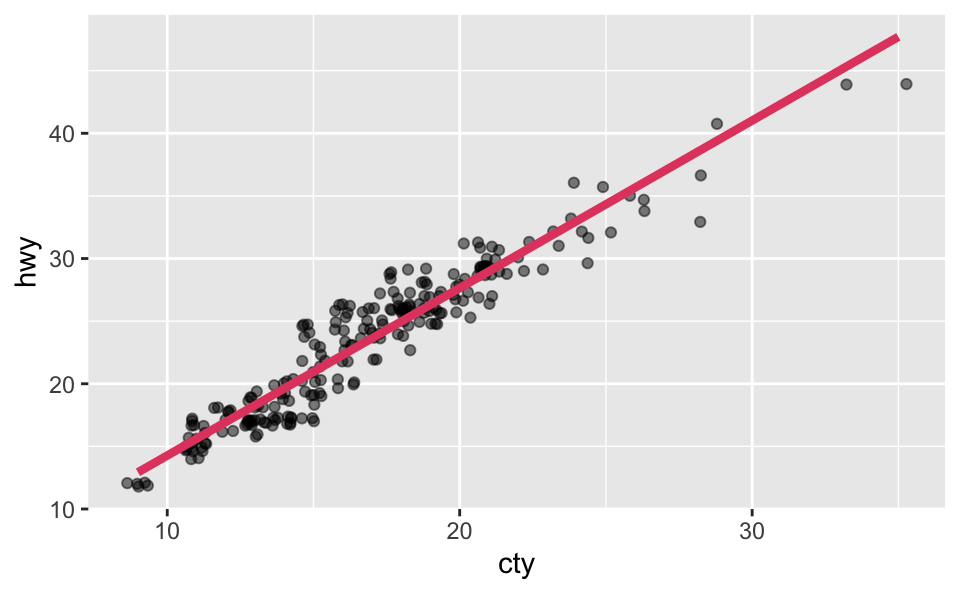
Regression line
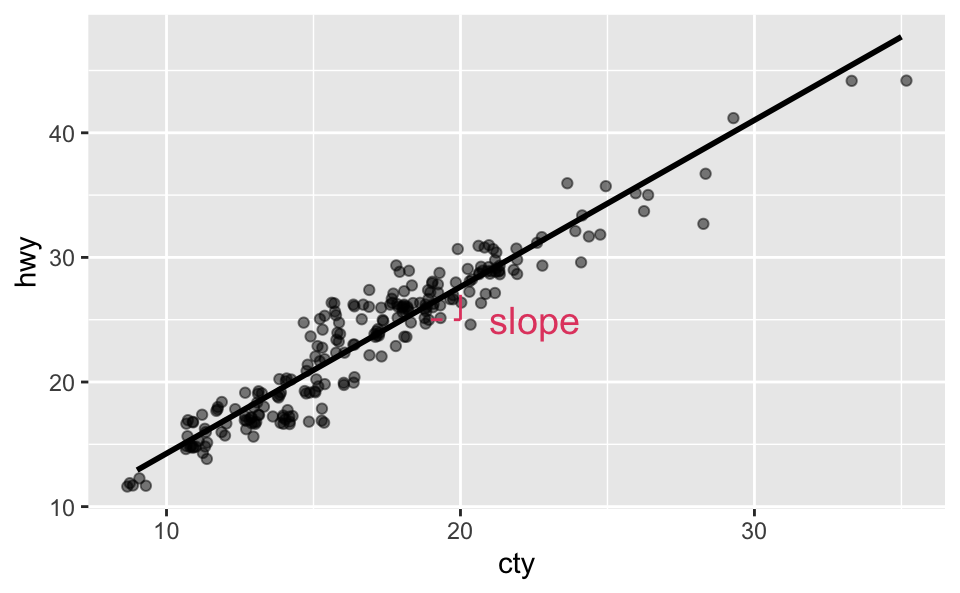
Regression line: slope
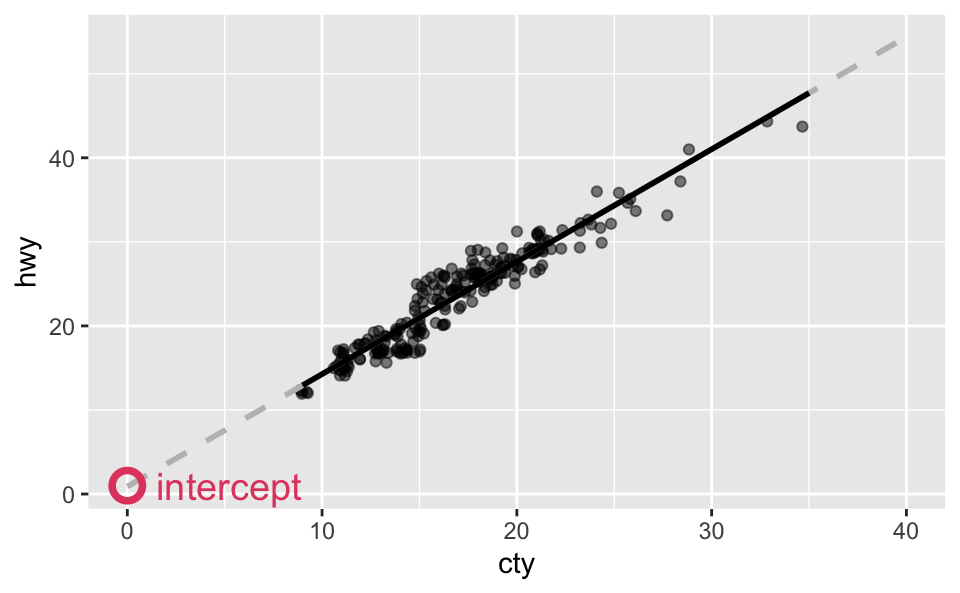
Regression line: intercept
Correlation
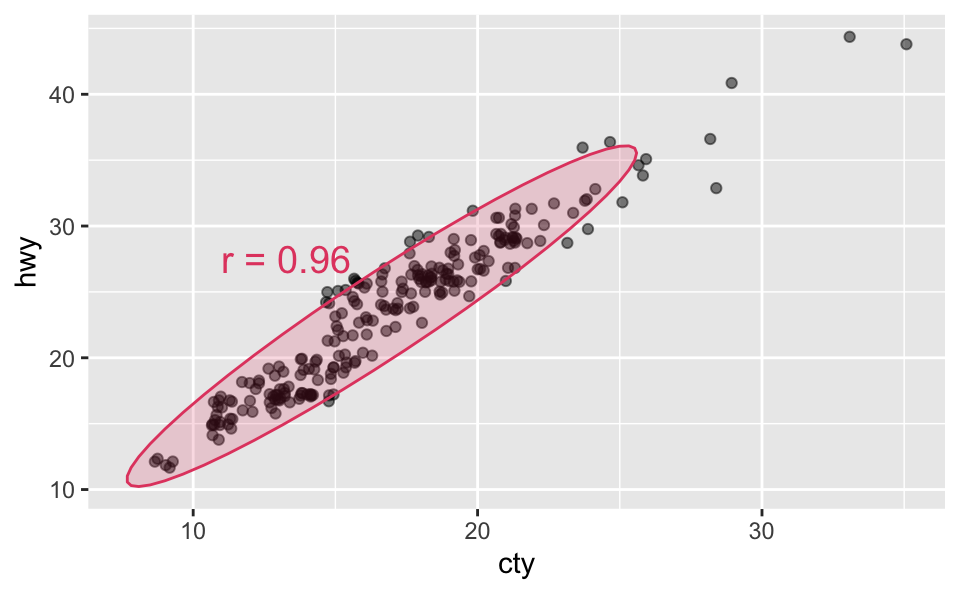
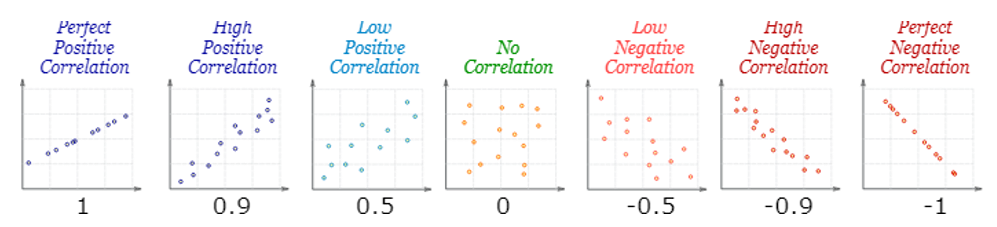
Correlation
- Ranges between -1 and 1.
- Same sign as the slope.
ae-09
- Go to the course GitHub org and find your
ae-09-fish(repo name will be suffixed with your GitHub name). - Click on the green CODE button, select Use SSH (this might already be selected by default, and if it is, you’ll see the text Clone with SSH). Click on the clipboard icon to copy the repo URL.
- In RStudio, go to File ➛ New Project ➛Version Control ➛ Git.
- Copy and paste the URL of your assignment repo into the dialog box Repository URL. Again, please make sure to have SSH highlighted under Clone when you copy the address.
- Click Create Project, and the files from your GitHub repo will be displayed in the Files pane in RStudio.
- Click ae-09-fish.qmd to open the template Quarto file. This is where you will write up your code and narrative for the lab.