library(mdsr)      # for the data
library(tidyverse) # for data visualization and wrangling
library(scales)    # for better axis labels
library(ggthemes)  # for better colors
library(ggrepel) # for avoiding ovarlap in plotsVisualizing data and investigating relationships
These are suggested answers to the application exercise. They may differ slightly from the code we developed in class and may not be complete. They’re provided after class to help review the application activity, but are not an alternative to working on the exercise and actively participating in class.
Goals
The main question we’ll explore today is “How are SAT scores and teacher salaries associated?” What do you think?
Along the way we will:
create data visualizations and calculating summary statistics for comparing trends across groups
distinguish observational studies and experiments
identify confounding variables and Simpson’s paradox
Data and packages
For this application exercise we’ll use the SAT_2010 from the mdsr package, which includes information on average SAT scores, average teacher salaries, and percentage of students taking SAT for each state. The data are from 2010.
Let’s first load the packages we’ll use:
Single variable
Analyzing the a single variable is called univariate analysis.
Create visualizations of the distribution of average SAT scores, total.
- Make a histogram. Set an appropriate binwidth.
ggplot(SAT_2010, aes(x = total)) +
  geom_histogram(binwidth = 40)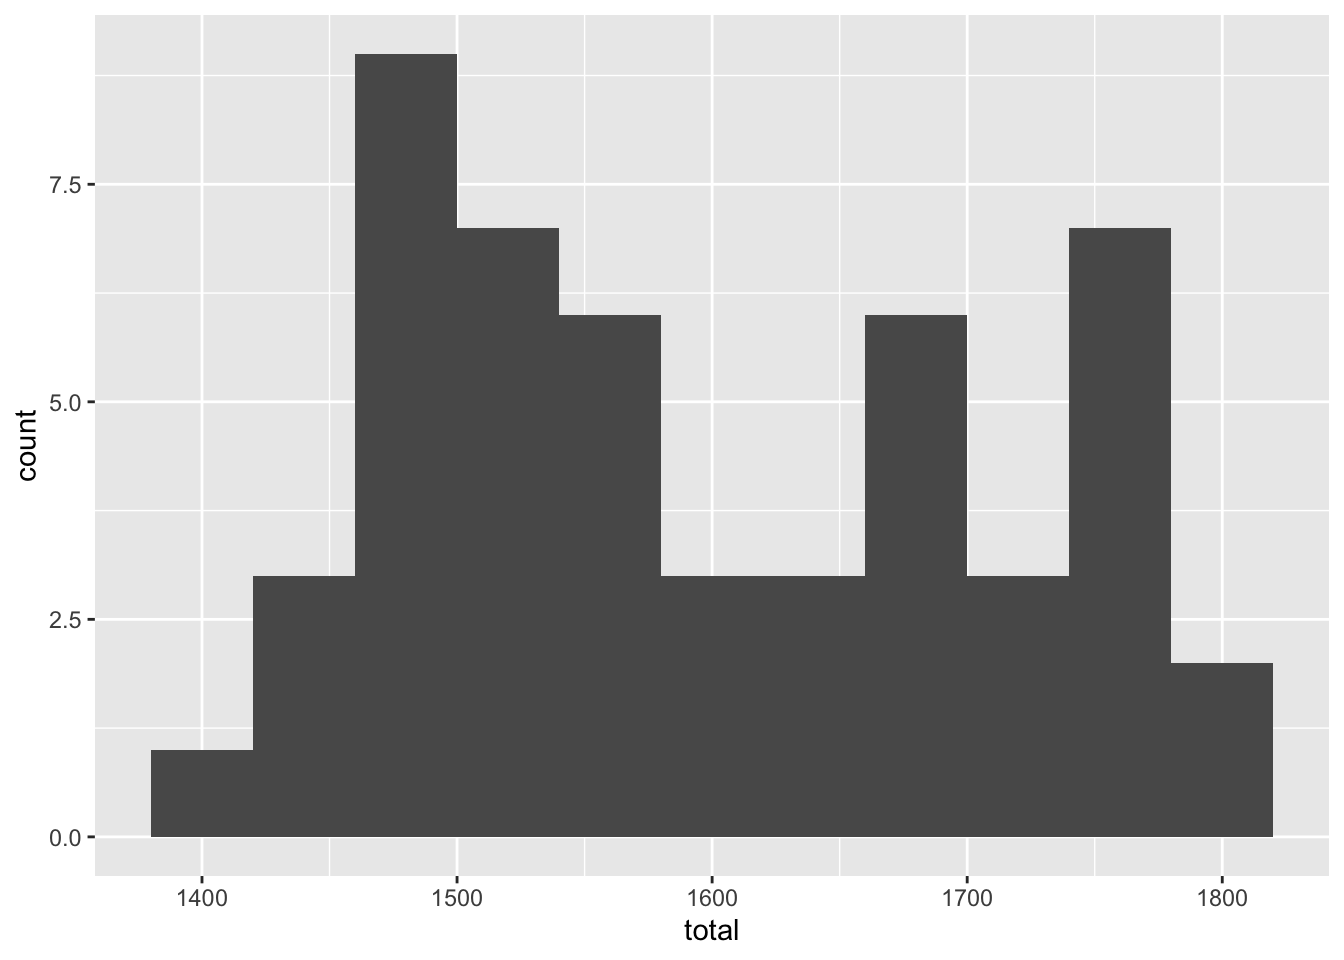
- Make a boxplot.
ggplot(SAT_2010, aes(x = total)) +
  geom_boxplot()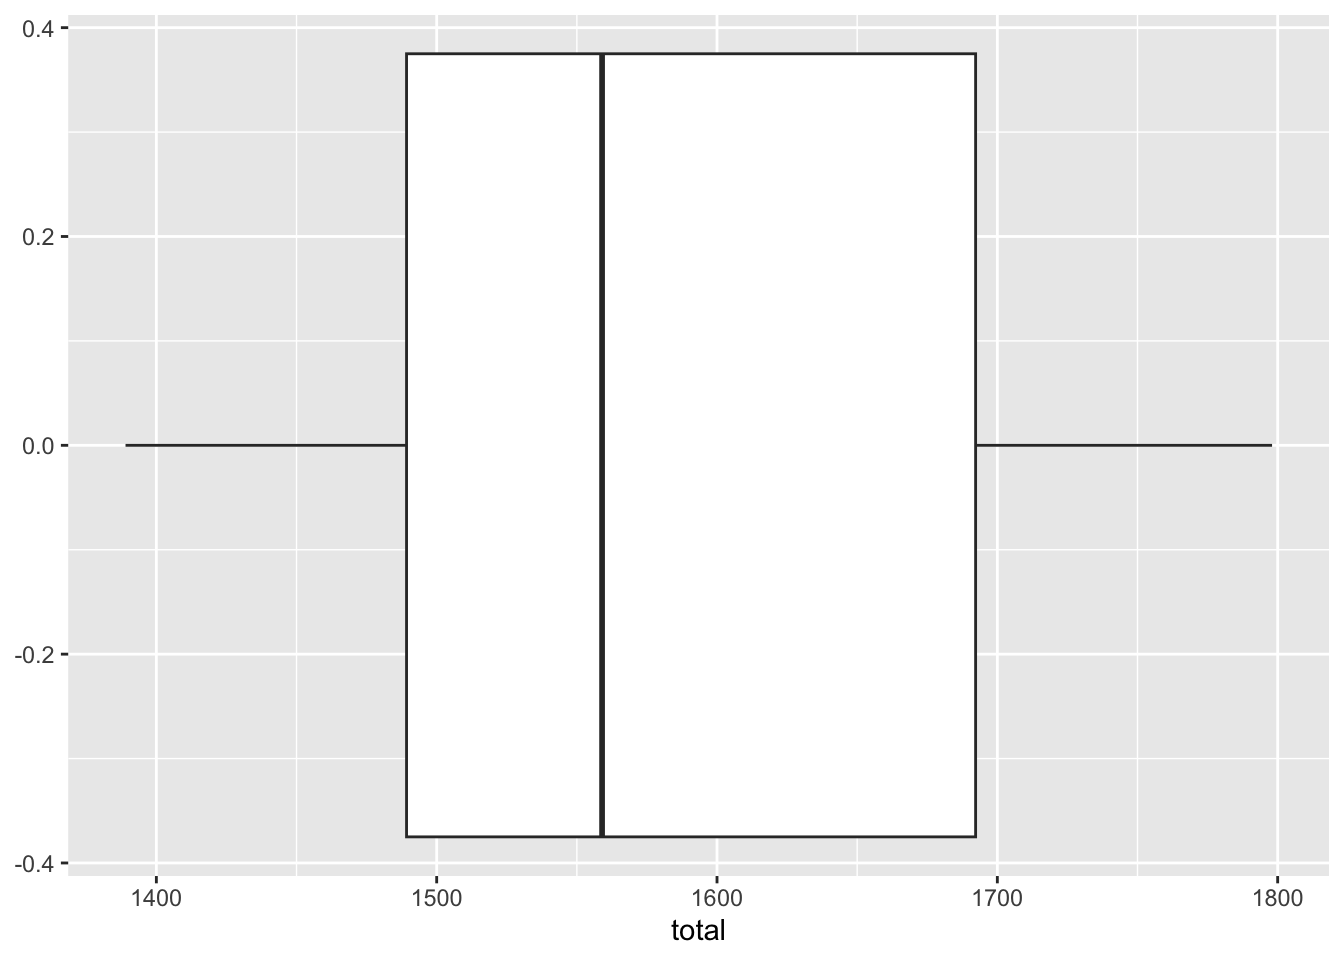
- Make a density plot.
ggplot(SAT_2010, aes(x = total)) +
  geom_density(fill = "gray")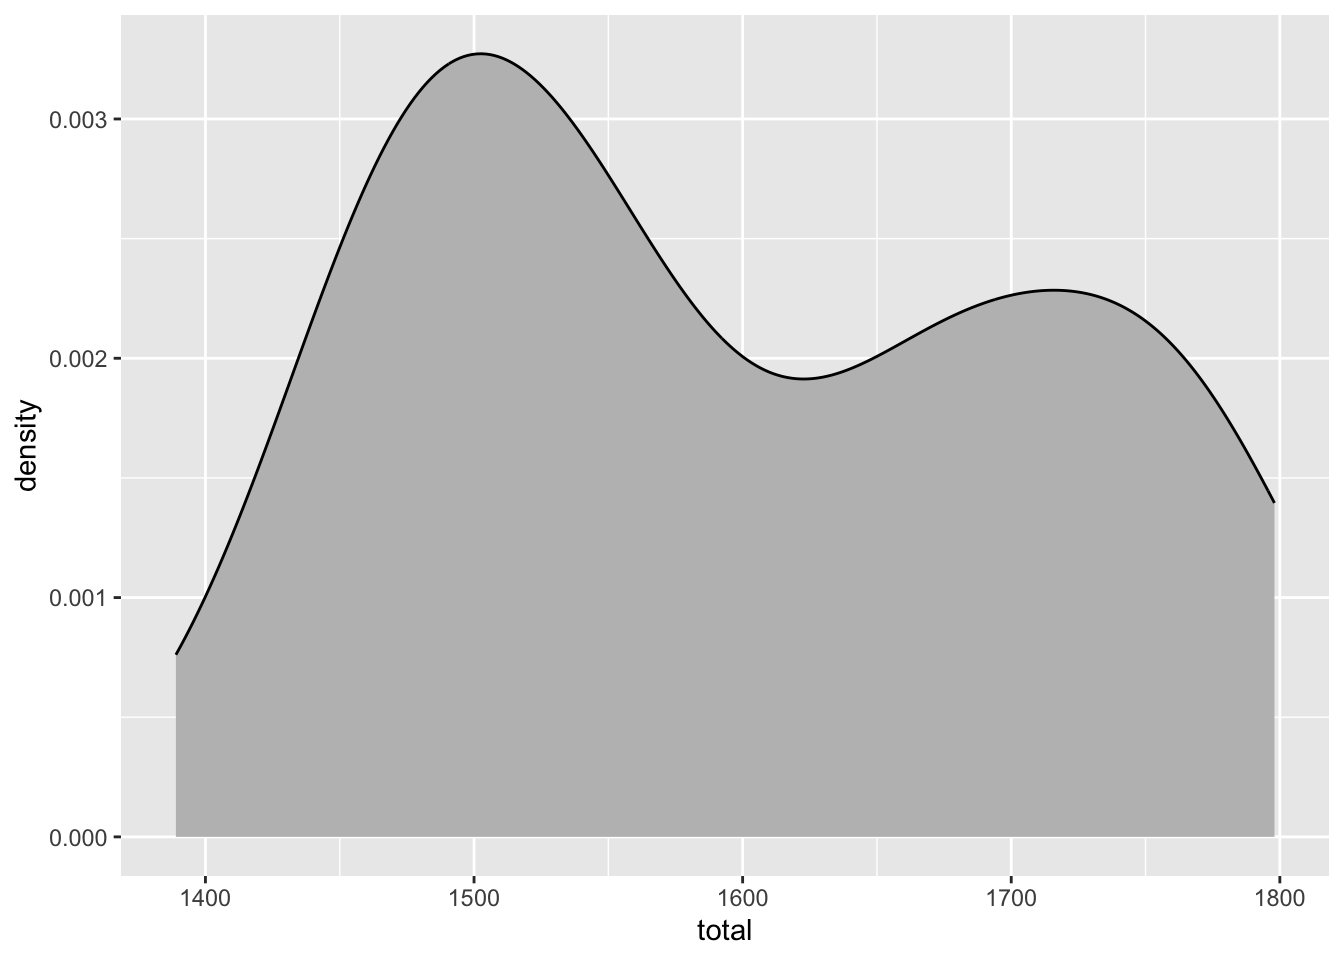
Based on these, determine if each of the following statements about the shape of the distribution is true or false.
The distribution of average SAT scores in 2010 is right skewed. ___
The distribution of average SAT scores in 2010 is unimodal. ___
Two variables
Analyzing the relationship between two variables is called bivariate analysis.
- What would you expect the relationship between average SAT scores (
total) and average teacher salaries (salary) to look like? What type of plot would you use to visualize this relationship? Create the plot below.
Add your answer here.
ggplot(SAT_2010, aes(x = salary, y = total)) +
  geom_point() +
  geom_smooth(method = "lm")
`geom_smooth()` using formula = 'y ~ x'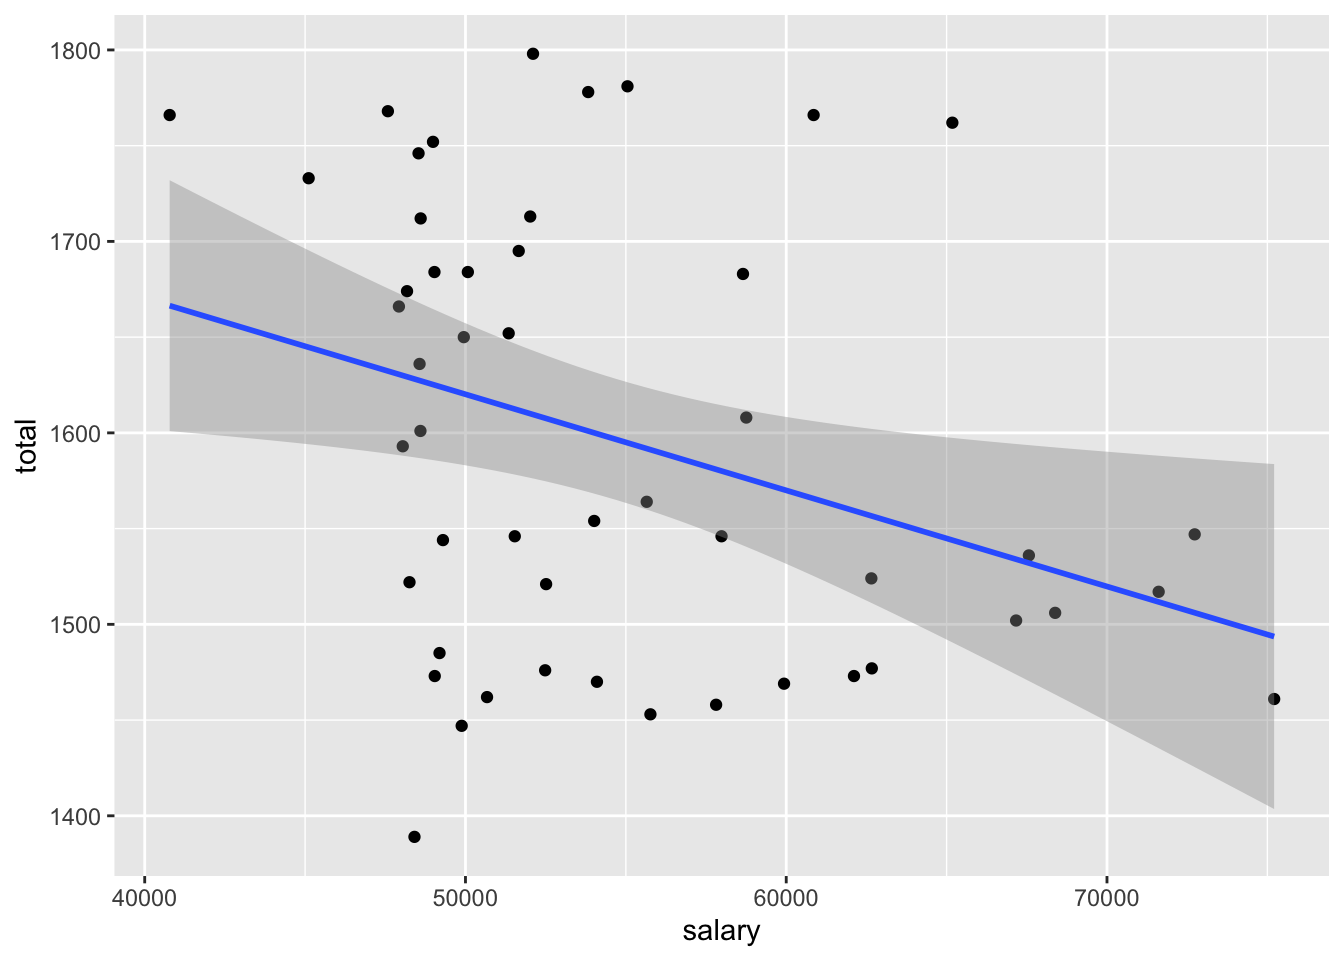
- Lurking in the background, however, is another important factor. The percentage of students who take the SAT in each state varies dramatically between states. First, let’s visualize the distribution of this variable,
sat_pct.
Add your response here.
ggplot(SAT_2010, aes(x = sat_pct)) +
  geom_histogram()
`stat_bin()` using `bins = 30`. Pick better value with `binwidth`.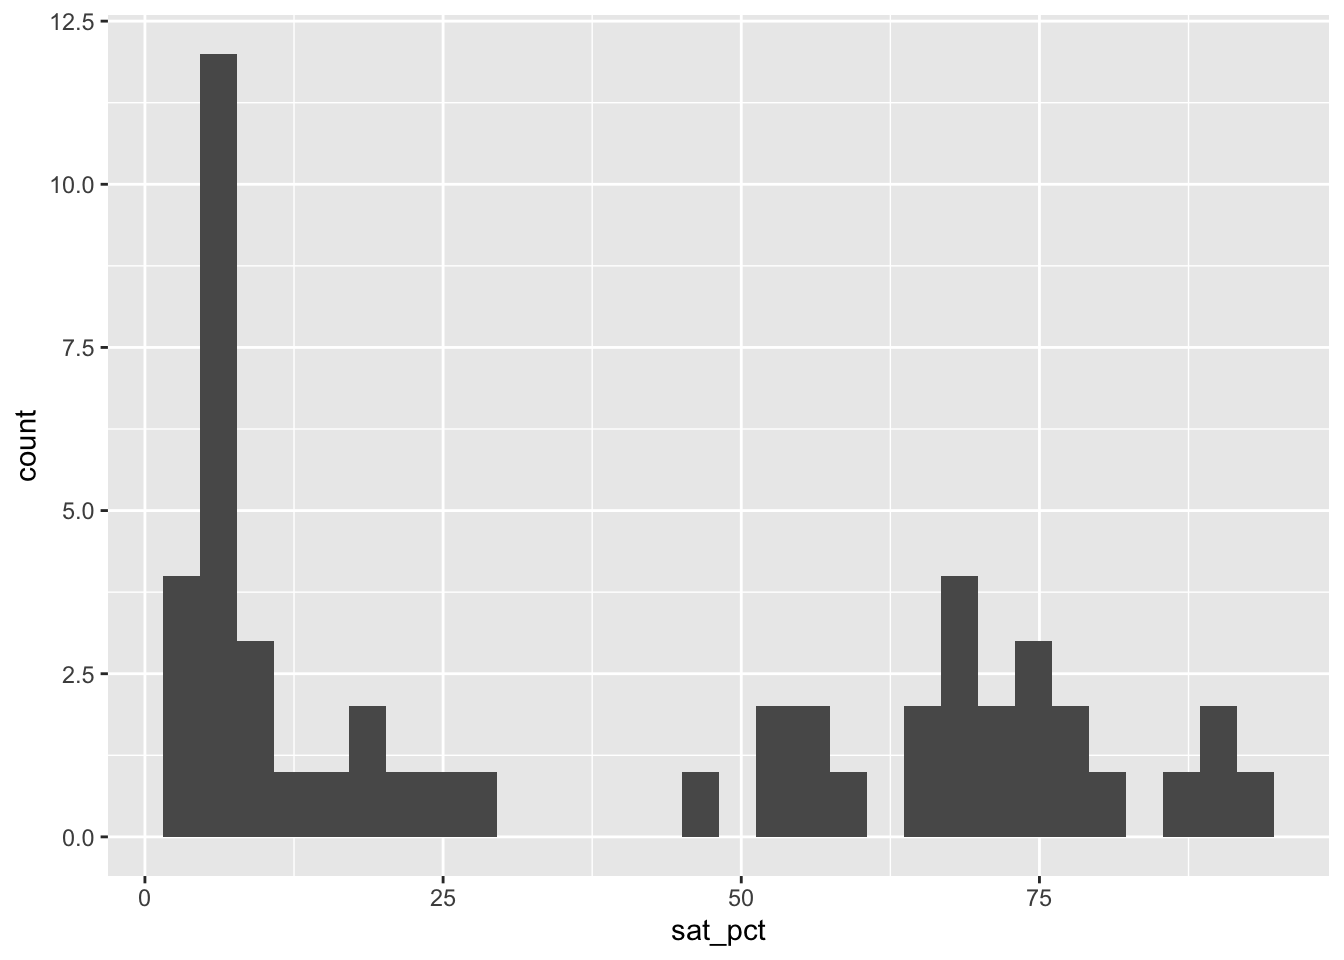
- Let’s label states with low SAT participation
"Low"and the others"High". For the cutoff point, let’s use the median participation level.
Add your response here.
SAT_2010 |>
  summarize(med = median(sat_pct))
med
1 27SAT_2010 <- SAT_2010 |>
mutate(sat_pct_grp = ifelse(sat_pct <= 27, "Low", "High"))Multiple variables
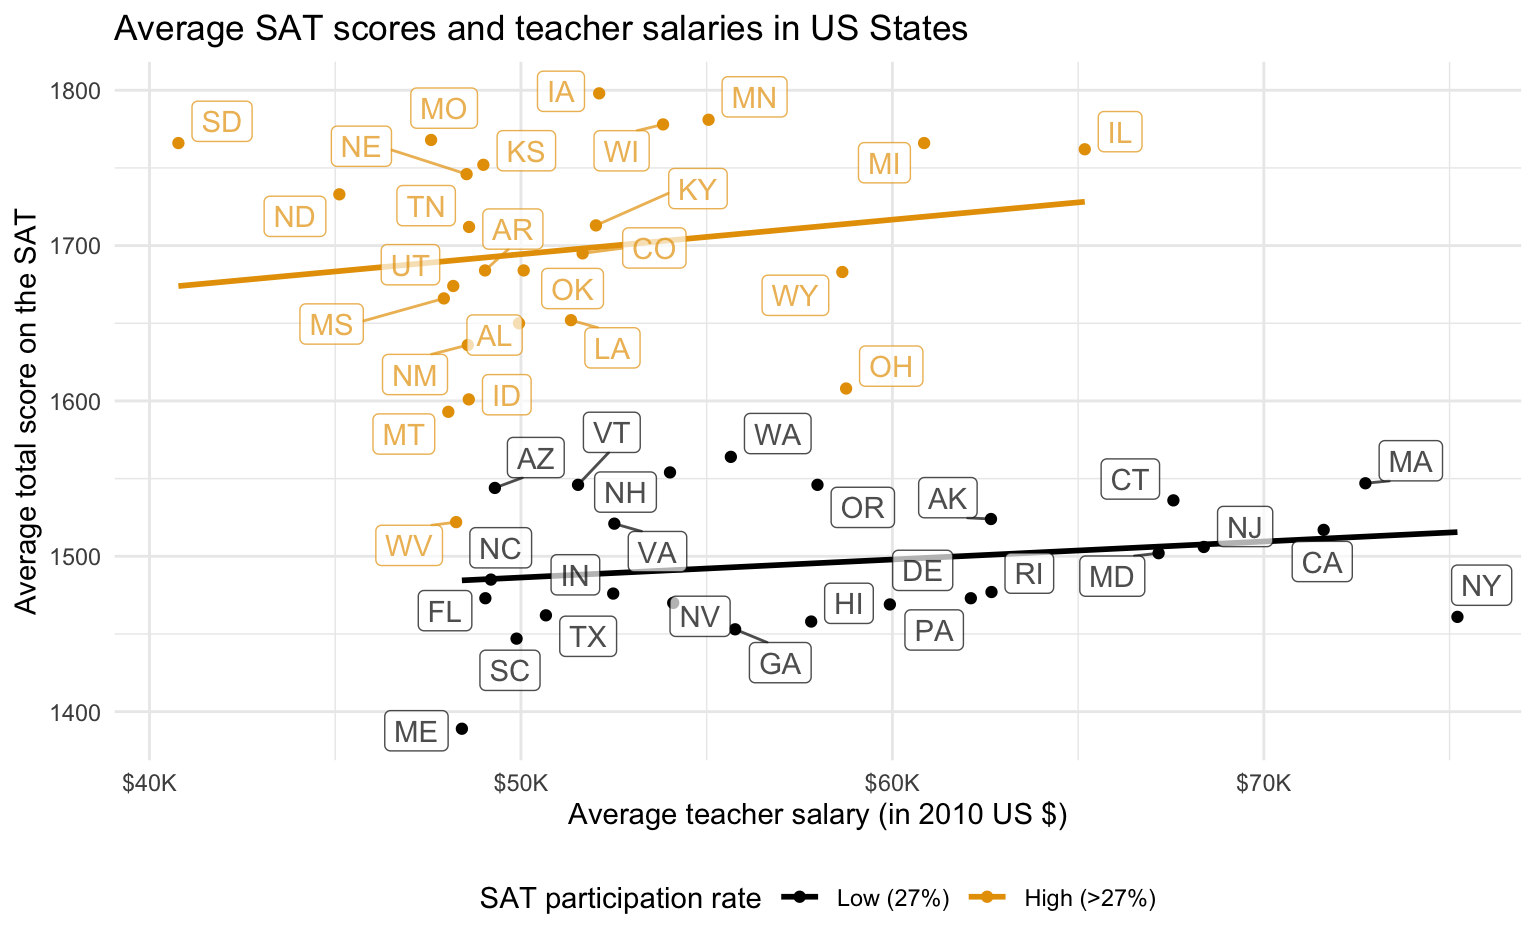
- Recreate the scatterplot of average SAT scores, this time coloring each state based on whether they had low or high participation in the SAT. Describe the relationship between SAT scores and teacher salaries, when conditioning on SAT participation.
ggplot(SAT_2010, aes(x = salary, y = total, color = sat_pct_grp)) +
  geom_point() +
  geom_smooth(method = "lm")
`geom_smooth()` using formula = 'y ~ x'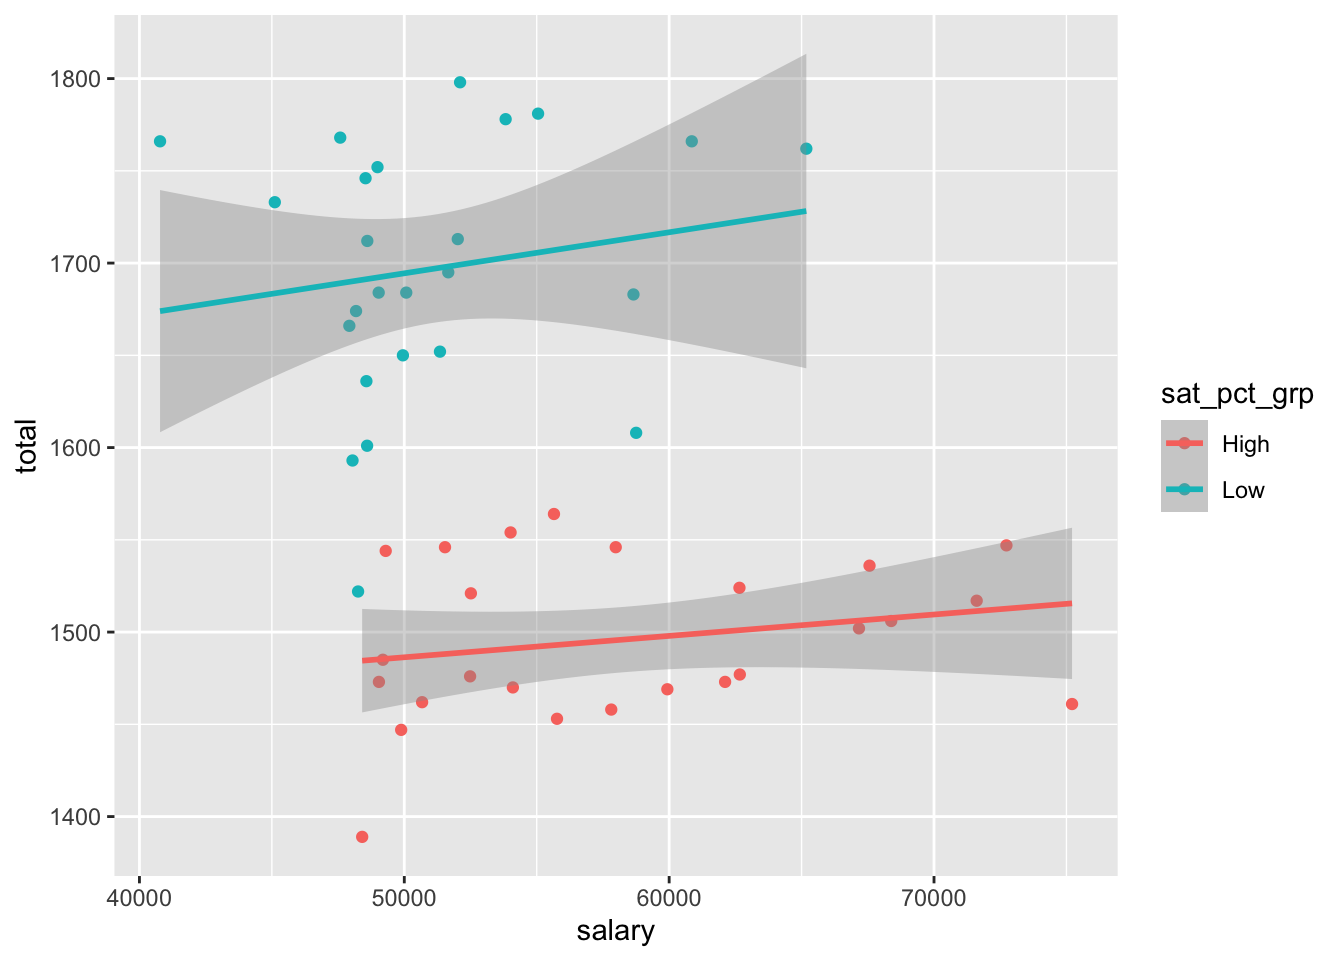
- Fill in the blanks below.
Among all states, salaries and SAT scores are ___ associated.
Among states with a low percentage taking the SAT, teacher salaries and SAT scores are ___ associated.
Among states with a high percentage taking the SAT, teacher salaries and SAT scores are ___ associated.
This phenomenon is called Simpson’s paradox – a trend appears in subsets of the data, but disappears or reverses when the subsets are combined. The paradox can be resolved when confounding variables and causal relations are appropriately addressed in the analysis. In the above example, the confounding variable is SAT participation rate.
- Improve the visual display of the plot you just created.
ggplot(SAT_2010, aes(x = salary, y = total, color = sat_pct_grp)) +
  geom_point() +
  geom_smooth(method = "lm") +
  labs(
    x = "Average teacher salary ((in 2010 US $)",
    y = "Average total score on the SAT",
    color = "SAT participation rate",
    title = "Average SAT scores and teacher salaries in US States"
  ) +
  scale_color_colorblind(labels = c("Low (27%)", "High (>27%)")) +
  scale_x_continuous(labels = label_dollar(scale = 1/1000, suffix = "K")) +
  theme_minimal() +
  theme(legend.position = "bottom")
`geom_smooth()` using formula = 'y ~ x'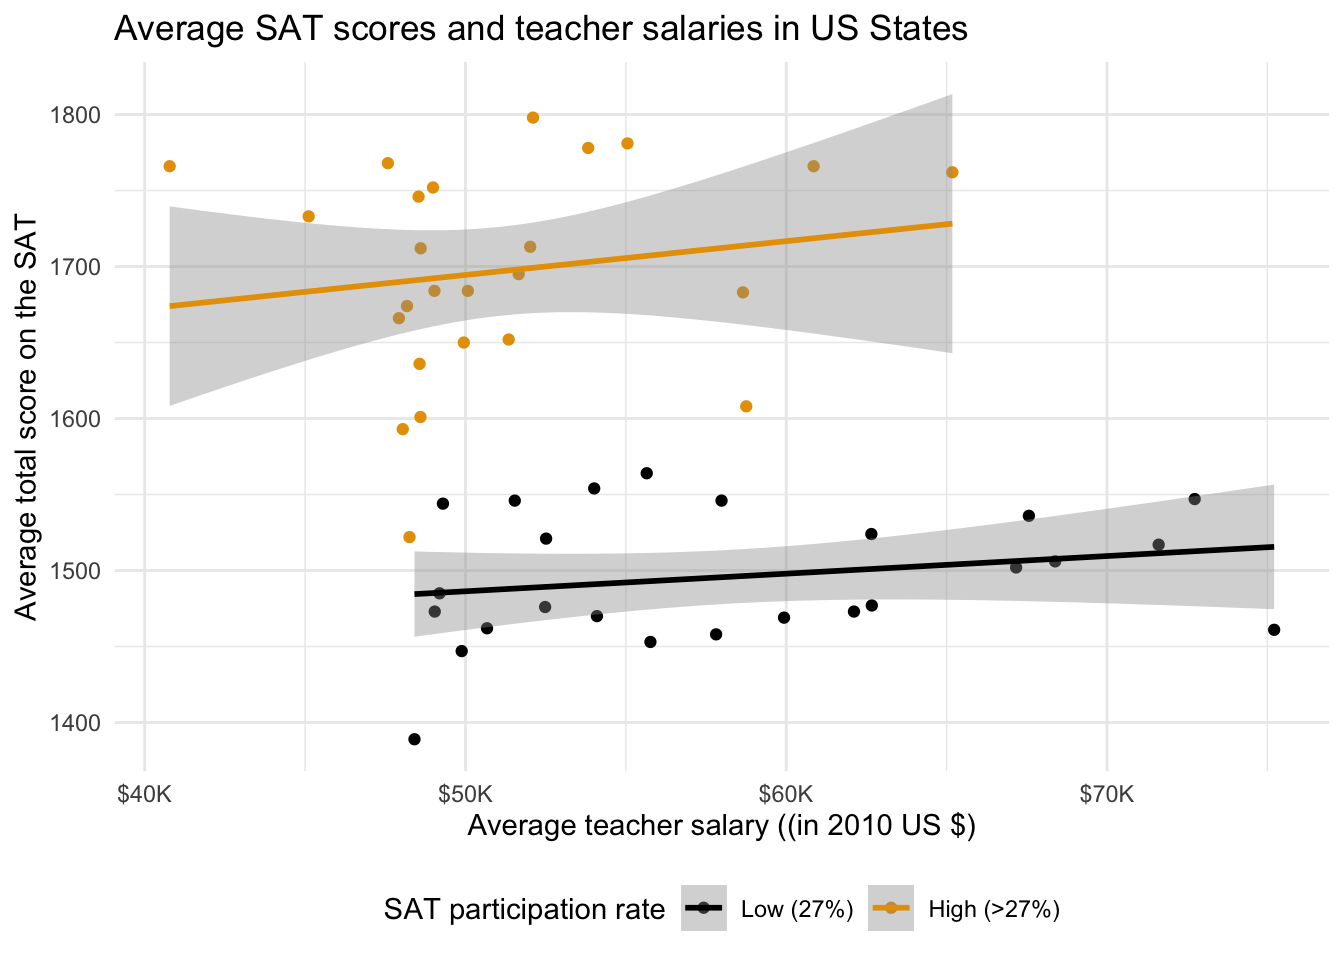
Looking forward
Below is an example of a type of plot you’ll be making soon! Review the plot and the code. How is it different from what we had before? What aspects of it do you like better? Are there any aspects you don’t like? Are there any features of the plot that you can identify the corresponding code for? Are there any features that you can’t identify the code for and you’d like to learn?
states <- tibble(
  state_name = state.name,
  state_abb = state.abb
)

SAT_2010 |>
  left_join(states, by = join_by(state == state_name)) |>
  ggplot(aes(x = salary, y = total, color = sat_pct_grp)) +
  geom_smooth(method = "lm", se = FALSE) +
  geom_point() +
  geom_label_repel(aes(label = state_abb), alpha = 0.7, show.legend = FALSE) +
  labs(
    x = "Average teacher salary (in 2010 US $)",
    y = "Average total score on the SAT",
    color = "SAT participation rate",
    title = "Average SAT scores and teacher salaries in US States"
  ) +
  scale_color_colorblind(labels = c("Low (27%)", "High (>27%)")) +
  scale_x_continuous(labels = label_dollar(scale = 1/1000, suffix = "K")) +
  theme_minimal() +
  theme(legend.position = "bottom")