library(tidyverse)
library(scales)

hotels <- read_csv("https://raw.githubusercontent.com/rfordatascience/tidytuesday/master/data/2020/2020-02-11/hotels.csv")Grammar of data wrangling
Application exercise
Sugested answers
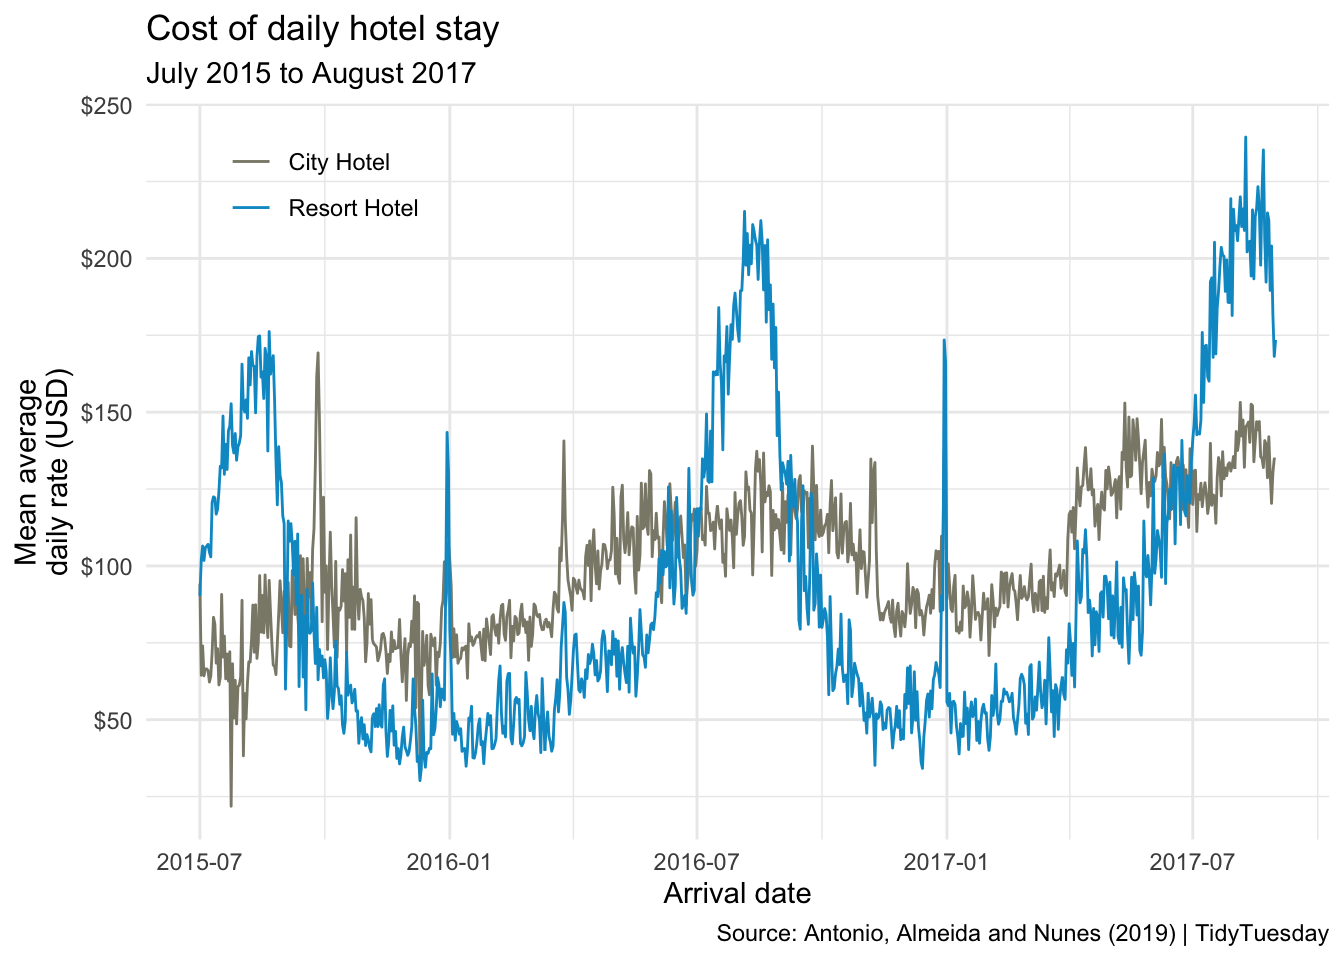
Recreate the visualization from the slides.
hotels |>
  mutate(
    arrival_date = paste(arrival_date_year, arrival_date_month, arrival_date_day_of_month),
    arrival_date = ymd(arrival_date)
    ) |>
  group_by(hotel, arrival_date) |>
  summarise(mean_adr = mean(adr), .groups = "drop") |>
  ggplot(aes(x = arrival_date, y = mean_adr, group = hotel, color = hotel)) +
  geom_line() +
  scale_color_manual(values = c("cornsilk4", "deepskyblue3")) +
  scale_y_continuous(labels = label_dollar()) +
  labs(
    x = "Arrival date",
    y = "Mean average\ndaily rate (USD)",
    color = NULL,
    title = "Cost of daily hotel stay",
    subtitle = "July 2015 to August 2017",
    caption = "Source: Antonio, Almeida and Nunes (2019) | TidyTuesday"
  ) +
  theme_minimal() +
  theme(legend.position = c(0.15, 0.9))